From AWS official documentation...
"With CloudWatch RUM, you can perform real user monitoring to collect and view client-side data about your web application performance from actual user sessions in near real time. The data that you can visualize and analyze includes page load times, client-side errors, and user behavior. When you view this data, you can see it all aggregated together and also see breakdowns by the browsers and devices that your customers use."
So I decided to "play" with it a little bit and share my experience with you.First of all I created new EC2 instance with Apache and placed it behind Application Load Balancer
 |
I am not going to describe how to create EC2 with Apache and Load Balancer. There is literally tons of material how to create it.
The client will access the Apache web server. Inside this web service I will place 2 simple pages "index.html" and "page.html". The actually interaction with "CloudWatch" is done by JavaScript which is embedded to each page.
How do you generate this JavaScript?
Go to "CloudWatch RUM" page.

and click "Add App monitor"
For this basic example all you need is to enter the monitor name and the domain name of your Application Load Balancer

and click 
This is the javascript you need to embed to each page in your application.
After the monitor is created go to the list view of monitors and click on the "View JavaScript"
 |
As I mentioned I created 2 pages. (I changed the GUID and AWS account number for the security reason)
index.html
<html>
<head>
<script>(function(n,i,v,r,s,c,x,z){x=window.AwsRumClient={q:[],n:n,i:i,v:v,r:r,c:c};window[n]=function(c,p){x.q.push({c:c,p:p});};z=document.createElement('script');z.async=true;z.src=s;document.head.insertBefore(z,document.head.getElementsByTagName('script')[0]);})('cwr','3XXXXXXXXXX-bcd6-560ac0152ba0','1.0.0','eu-central-1','https://client.rum.us-east-1.amazonaws.com/1.2.1/cwr.js',{sessionSampleRate:1,guestRoleArn:"arn:aws:iam::66666666666:role/RUM-Monitor-eu-central-1-621094298987-6633853759461-Unauth",identityPoolId:"eu-central-1:fc86651c-d9c1-4387-8a3a-99e23dd77fec",endpoint:"https://dataplane.rum.eu-central-1.amazonaws.com",telemetries:["performance","errors","http"],allowCookies:true,enableXRay:false});</script>
</head>
<body>
Hello from index.html
<a href="page.html">Go to page.html</a>
</body>
</html>
<html>
<head>
<script>(function(n,i,v,r,s,c,x,z){x=window.AwsRumClient={q:[],n:n,i:i,v:v,r:r,c:c};window[n]=function(c,p){x.q.push({c:c,p:p});};z=document.createElement('script');z.async=true;z.src=s;document.head.insertBefore(z,document.head.getElementsByTagName('script')[0]);})('cwr','3XXXXXXXXXX-c7a6-4be9-bcd6-560ac0152ba0','1.0.0','eu-central-1','https://client.rum.us-east-1.amazonaws.com/1.2.1/cwr.js',{sessionSampleRate:1,guestRoleArn:"arn:aws:iam::66666666666:role/RUM-Monitor-eu-central-1-621094298987-6633853759461-Unauth",identityPoolId:"eu-central-1:fc86651c-d9c1-4387-8a3a-99e23dd77fec",endpoint:"https://dataplane.rum.eu-central-1.amazonaws.com",telemetries:["performance","errors","http"],allowCookies:true,enableXRay:false});</script>
</head>
<body>
Hello from page.html
<a href="index.html">Go to index.html</a>
</body>
</html>
Next step, enter the index.html and start clicking
 |
| page.html |
 |
| index.html |
So I clicked about 20-30 times and here is the statistics.


Conclusion. The feature is working as expected. The statistic is presented in a friendly and accurate way.
Nice. But let us investigate it more. Lets connect out Application Load Balancer to Global Accelerator and check is we see the difference.
In order to monitor the change, you need to repeat the settings above and create new app monitor, this time you need to specify "Global Accelerator" domain name in the "Application Domain" field and update JavaScript in index.html and page.html
I did all those steps and here is the statistics I got
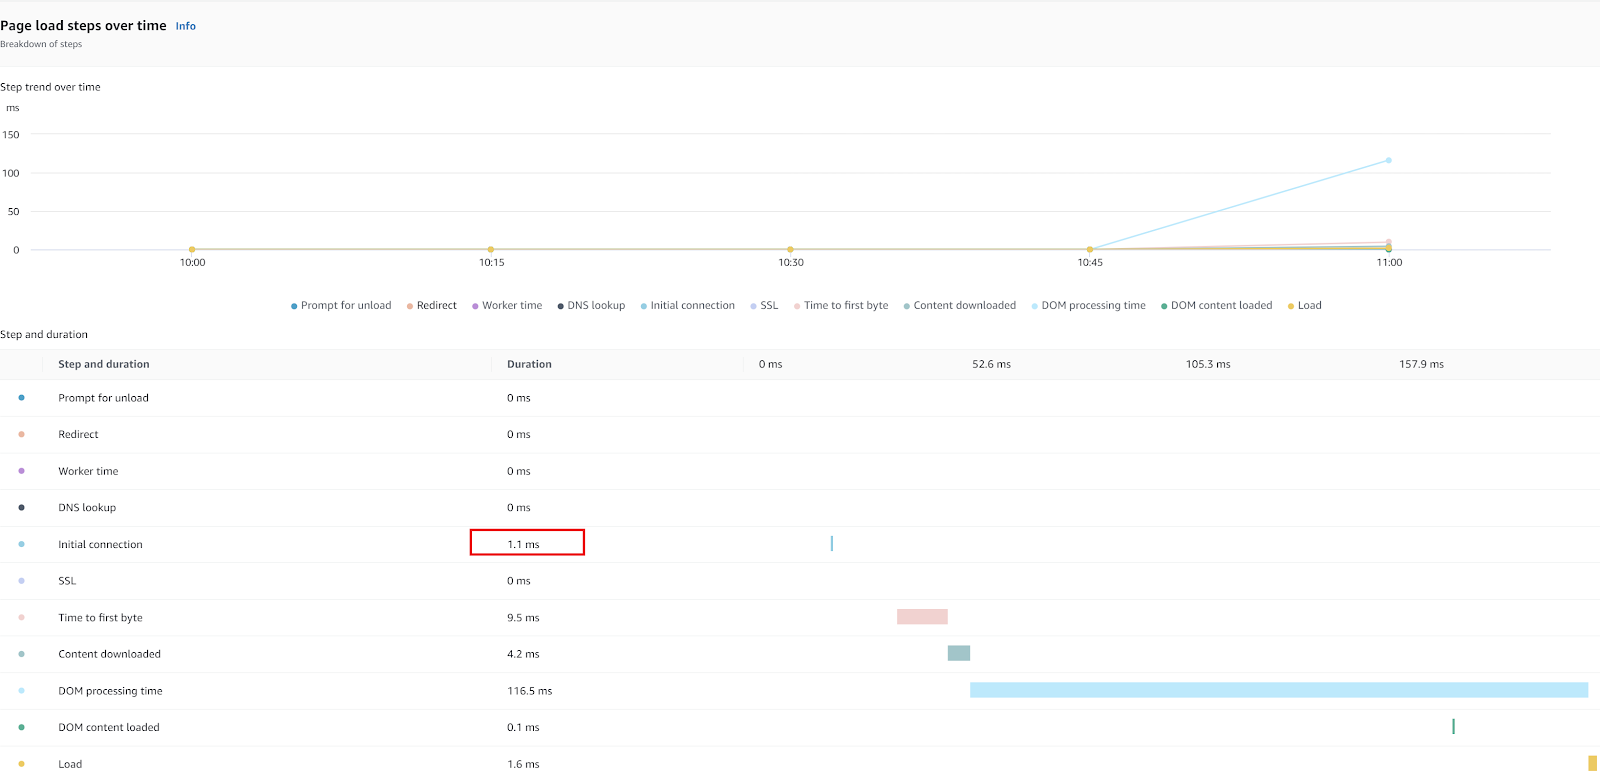
The initial connection with Global Accelerator is 1.1ms and without 1.4ms. The rest of the data is less interesting since it is related to my workstation performance. Also, the difference may seem to be very small, but also need to remember that the application is extremely simple.
Consultation.... I provided very simple example of the "Cloud Watch RUM". It has an ability to provide insight into "Load Performance Impact", "Runtime Impact" and "Network Impact".
There are options to collect HTTP error and also X-ray traces which are not covered in this post.